


 33 / 84

has value, not necessarily the “things”
(decoders, light bulbs and fixtures).
So one way to look at potential
TaaS development in telecom is to
see increasing management of appli-
ances and fixtures necessary to add
more value to the core “communica-
tions” value.
The other way to look at poten-
tial TaaS opportunities is to see that
most of the created value eventually
will come from analytics made pos-
sible by the big data gathered by the
sensor network and using the com-
munications services. Likewise, in the
“Internet of humans” space, at least a
few mobile service providers will ex-
periment with “mobility as a service,”
where “supplying handsets” becomes
a feature of a communications service
for business customers.
That is another example suggesting
that, if and when TaaS develops, early
traction might come where analytics
drive the new business value, enabled
by a managed offer bundling the sen-
sor network, the communications and
the analytics platform.
Later on, those sorts of
bundled offers might seem
quaint. But in the early go-
ing, it all might seem familiar
enough to ease adoption.
Businesses have an under-
standing of what intercon-
nects, value added resellers
and managed service provid-
ers do. Businesses under-
stand the value of communi-
cations, cloud computing and
business intelligence created
from mountains of raw opera-
tional data.
Mix it all together and you
wind up with TaaS, where it is
not the sensors but the analyt-
ics or the management that
drives the most value.
If you look at today’s con-
sumer Internet ecosystem, or
the business computing eco-
system, to the extent that “val-
ue” correlates with “revenue,”
then most of the revenue will
come from the content (consumer eco-
system) or the applications segment of
the business IT ecosystem.
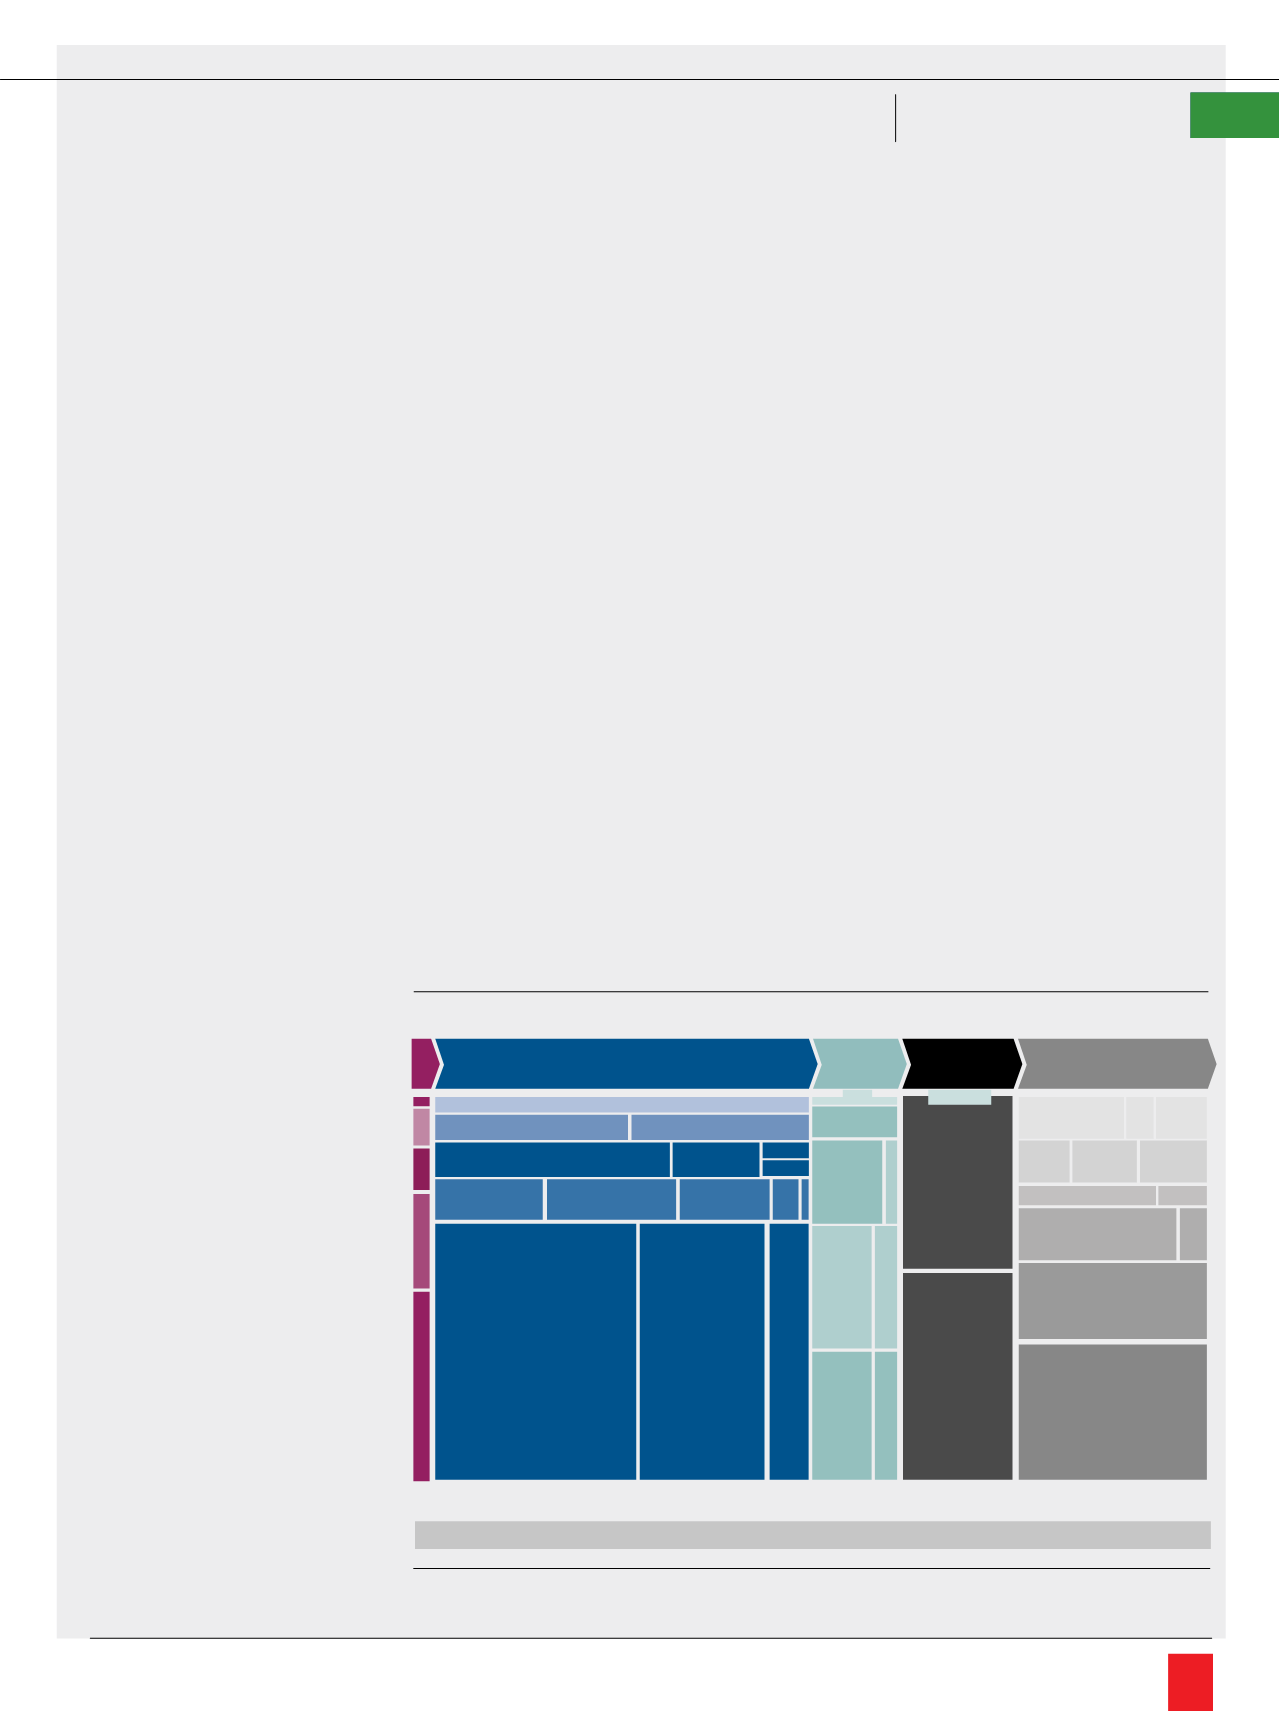
In 2015, for example, the GSMA
estimated the mobile ecosystem at
about $3.5 trillion. About 47 percent
of that was earned by content or
app providers. About 2 percent was
earned by content rights holders.
Roughly 23 percent was earned by
device, other hardware, operating
systems and other software.
Connectivity services represented
about 17 percent of ecosystem reve-
nue, according to GSMA, but other es-
timates assume higher percentages at-
tributable to access providers (perhaps
30 percent in the United Kingdom, as
much as 48 percent in Spain).
TaaS, then, would be part of the ap-
plications market segment, where the
IoT function is functionally a substitute
for 58 percent of the IoT revenue op-
portunity, assuming the Internet eco-
system provides an indicator.
In other words, TaaS should de-
velop as did other XaaS services:
applications, platforms and infrastruc-
ture, with a significant access services
component. It will be easiest for most
access providers to sell connectivity,
as presently is the case.
But as proven to be the case
for leading telecom providers in the
consumer segment of the business,
owning at least some of the applica-
tions delivered over the “dumb pipe” is
the fundamental strategy for dealing
with “commodity” products and reve-
nue streams. In similar fashion, at least
some tier-one access providers will
become owners of TaaS applications,
if not so much providers of platforms
or computing infrastructure, as distinct
from access services.
So sales opportunities for telecom
channel partners are likely to hinge on
the degree to which their underlying
suppliers achieve significant “hori-
zontal” roles in TaaS. In other words,
if app and service providers primarily
target general-purpose TaaS
(Sales- force.comas an example, or hosted
voice, rather than vertical apps target-
ed at industry verticals), the channel
opportunity will be greater.
at your service: Xaas
Source: TeleGeography
Source: Techaisle
Millennials in US Small Businesses (1-99 employ es)
Source: GSMA
Mobile Ecosystem Market Size by Segment and Category
30%
20%
10%
0%
2007 2008 2009 2010 2011 2012 2013 2014 2015 2016
Private Sha
41%
Employees
(weighted data)
35%
IT Decision
Makers
29%
Owners/CEOs/
Presidents
ONLINE SERVICES
OTHER E-SERVICE
OTHER E-SERVICE
SEARCH
PUBLISHING
B
2
C E-RETAIL
B
2
C E-RETAIL
E-TRAVEL
GAMING CAMPING
VIDEO
OTHER E-SERVICE
CONNECTIVITY USER INTERFACE
ENABLING
TECHNOLOGY
AND SERVICES
SOCIAL AND
COMMUNITY
PAYMENT
PLATFORMS
TOTAL MARKET = $3,463 BILLION
OPERATING
SYSTEMS
APP
STORES
MUSIC
SECURITY
AND
SOFTWARE
CONSOLES
TABLETS
SMART TVs
PCs
SMARTPHONES
STBs
AND
DMRs
WEARABLES
OTHER
SMART
ITEMS
OTHER
HARDWARE
FIXED
MOBILE
ADVERTISING
SERVICES
CORE NETWORK
AND INTERCHANGE
DESIGN AND
DEVELOPMENT
WEB HOSTING
AD AGENCIES
CONTENT DELIVERY
AND OPTIMIZATION
IP COMMS
M
2
M
SATELLITE
B2B
COMMS
CR
MUSIC
SPORTS
VIDEO
PUBLISHING
GAMING
64(2%)
1,637(47%)
373 (11%)
577 (17%)
813 (23%)
$ billion, % of total market, 2015
May - June, 2017
|
Channel
Vision
33