


 44 / 84

subscription-based (SaaS) business ap-
plications, we have and will continue to
see a proliferation of new players and
new types of application categories,
says Forresters. For example, in the
e-commerce application category alone,
Forrester cataloged 45 subcategories
and nearly 500 vendors. All the while,
many non-incumbent providers have
been able to gain a significant foothold.
“The leading SaaS pure-play ven-
dors by revenue size continue to grow
at rates exceeding 20 percent,” finds
Forrester. Salesforce (23 percent),
NetSuite (35 percent) and Ultimate
Software (23 percent) all have enjoyed
sustained and consistent growth over
multiple years, says Forrester. Work-
day’s growth rates, though slowing re-
cently, have been even higher.
Indeed, “Forrester’s analysis of the
evolution of the business applications
market over the past decade indicates
that the large, traditionally on-premises
vendors (IBM, Infor, Microsoft, Oracle,
SAP) are losing share to faster-growing,
cloud-native rivals,” said the research
firm. The five largest traditional ven-
dors, named above, will go from a col-
lective business process applications
share of 25 percent in 2010 to a share
of 21 percent in 2017.
SaaS pure-plays Salesforce, Work-
day and NetSuite, meanwhile, plus
SaaS converts Intuit and Adobe have
grown their collective share during the
same period from 4 percent to 11 per-
cent, says Forrester. “All other provid-
ers” – presumably the group telecom
channels would fall under – account for
just less than 70 percent of global busi-
ness application revenues.
Not that traditional providers have
fallen asleep at the switch. “Virtually
every traditionally on-premises software
vendor we have spoken with in 2015 is
seeing significant growth in subscription
revenues and flat to declining license rev-
enues,” said the Forrester study on the
business process application market.
In terms of the overall size of the
opportunity, Forrester’s global mar-
ket analysis indicates that the core
business process applications seg-
ment, supporting both customer and
efficiency-focused solutions, will grow
from $141 billion in 2015 to $156 bil-
lion in 2016 and $169 billion in 2017.
Among the primary categories that fall
under “business process applications”
are customer relationship management
(CRM), call center/contact center sys-
tems, human resource management
(HRM), product lifecycle management
(PLM), e-purchasing, and specific prod-
ucts within financial management such
as accounts receivables.
“The market is a dynamic one be-
cause clients are continually looking
for new packaged apps for increasingly
specialized business processes,” say
Forrester researchers.
U.S. sales dominate and set the
pace of the market, with 52 percent of
the $156 billion market for business
process applications in 2016 coming
from purchases in the U.S., Forrester
estimates. An additional 5 percent will
originate in Canada and Latin America.
CRM, commerce servers and human
resources management are the fastest-
growing categories of process apps, at
20 percent, 17 percent, and 16 percent,
respectively, reports Forrester.
SaaS business process applications
represent about one-third of the market
currently and will grow by 24 percent
in 2016, significantly faster than the
overall market, which has a 12 percent
growth rate. The U.S. share of the global
SaaS process application market is
even higher than the overall, rising to 64
percent, up from 61 percent in 2013.
Once again, SaaS subscriptions are
driving revenue growth for the business
applications landscape, as license reve-
nues decline and maintenance revenues
grow at a slower pace, says Forrester. In
2012, subscriptions represented $22
billion in revenues; in 2016, Forrester
projects that subscriptions will be $53
billion. Looking beyond 2017, Forrester
expects SaaS subscriptions will con-
tinue to grow rapidly through 2020, gen-
erating more than half of total software
revenues by 2020.
That’s partly because a quarter to
a third of enterprise buyers surveyed
by Forrester in the fourth quarter of
last year said they plan to replace
most or all of the 12 types of business
applications covered by the Forrester
study with SaaS within the next two
years. In addition, 19 percent to 23
percent have already replaced these
applications with SaaS.
“While SaaS adoption is growing
in all process application categories,
adoption rates vary widely across
categories,” according to Forrester
researchers.
In 2016, for instance, more than
half of all product revenues in CRM,
commerce servers and e-purchasing
will come from SaaS subscriptions. The
SaaS share is even higher in some sub-
categories in marketing automation in
CRM, as well as services procurement
and network services in e-purchasing,
where 80 percent to 90 percent of rev-
enues are from SaaS subscriptions.
All the while, human resources
software, risk management and pay-
ment, and supply chain management
(SCM) apps are tilting toward SaaS,
anies studied
Source: Forrester Research
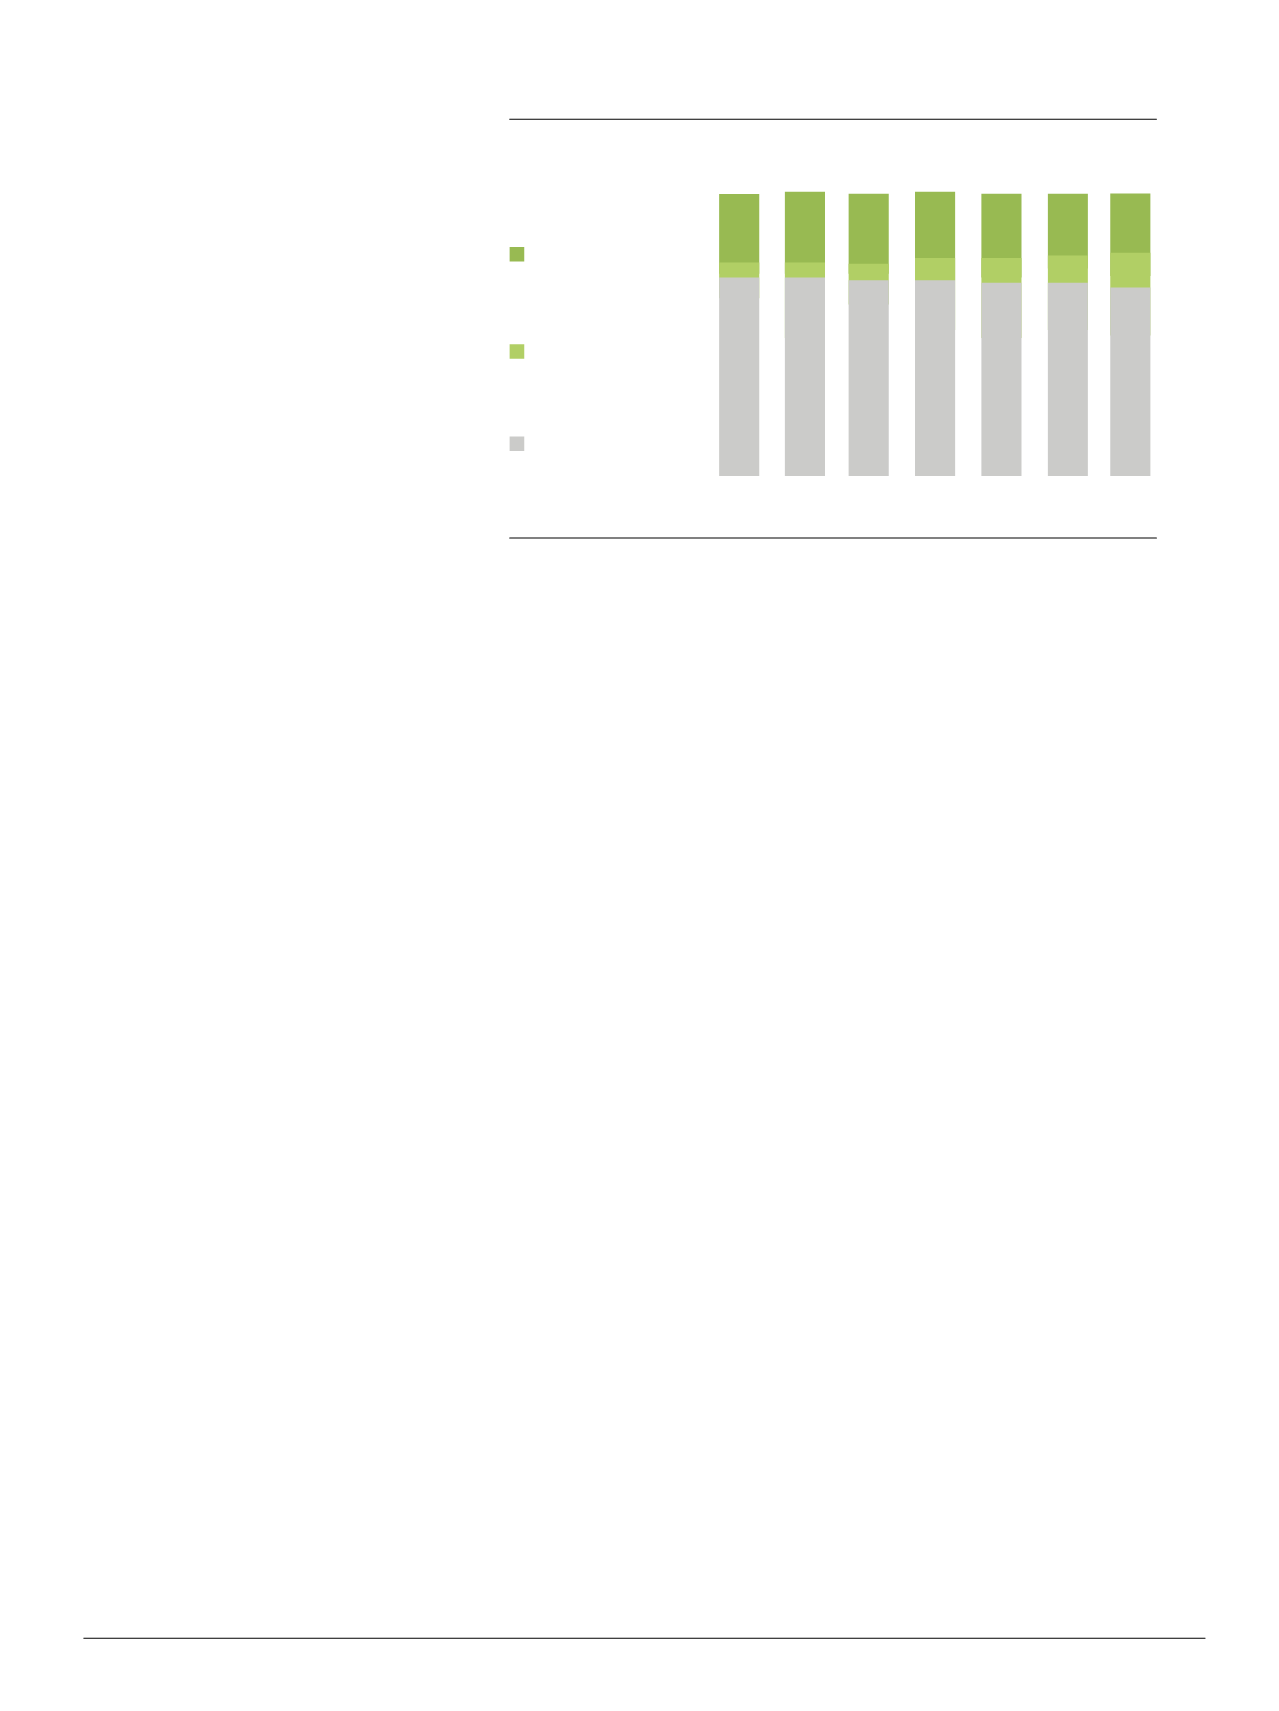
Global application revenues by type of vendor
(percentage of total market share)
ch
ers
2015 2016 2017 2018
earch
Mobile Search
$58,095,571
$60,525,947
$65,047,302
80,000,000 $75,000,000
Five leading traditional
process app vendors
(IBM, Infor, Microsoft,
Oracle, SAP)
Five leading SaaS
process app vendors
(Adobe, Intuit, NetSuite,
Salesforce, Workday)
All other vendors
26%
5%
69%
26%
6%
69%
25%
6%
68%
24%
8%
69%
24% 23% 22%
8% 9% 10%
68% 68% 67%
2011
100%
100%
80%
60%
40%
20%
0%
100% 100% 100% 100% 100% 100%
2012 2013 2014 2015* 2016* 2017*
Source: Forrester Research
Global business process pplications product rev nues
by type of r venue
Software-as-a-service (SaaS) subscription as
a percentage of total product revenues 2016
Maintenance revenues
Licenso revenues
Software-as-service
(Sa S) subscription revenues
2011 2012 2013 2014 2015* 2016* 2017*2018* 2019* 2020*
(percentage of total revenue)
Customer relationship management
Commerce servers
ePurchasing and business networks
Human resourc s management
Risk management and payment
Supply chain management
Governance, risk, and compliance
Financial management systems
Product life-cycle management
Call center/contact center systems
56%
55%
53%
41%
38%
30%
23%
22%
11%
10%
2020
44
CHANNEL
VISION
|
July - August 2016