


 48 / 76

Verizon would rank fourth. CenturyLink would rank
fifth, Cablevision Systems sixth and Frontier Communica-
tions seventh.
In the top five spots, cable TV companies would be num-
ber one and two providers, with even the largest U.S. telcos
ranking third, fourth and fifth.
There are a few additional questions which might engage
many observers of the telecom business.
Among the most startling possibilities is that former in-
cumbent telcos might struggle to maintain even the number-
two positions in some markets.
Some might argue it is only a matter of time before cable
TV operators build on their success in the smaller business
segment to move up to enterprise services as well as mobility.
If, someday, providers such as Google Fiber (and possibly
others) start to take more share in consumer and business
markets, while other providers (cloud and mobile services
providers, for example) chip away at revenues in the business
markets, could telcos actually fall into third place, at least in
some markets?
Another issue is the ultimate role of mobile and fixed
services generally. Up to this point, mobile networks have
not been real substitutes for fixed Internet access. But that
could change.
We might not get a clear answer to the amount of viable
business mobile-fixed substitution until fifth and subsequent
generations of mobile networks are widely deployed. The
design standards call for gigabit, up to 10-Gbps downstream
speeds for standard mobile devices.
That should be plenty fast to make
mobile access a functional substitute for
fixed access. The business issues include
tariff levels and usage buckets. The mo-
bile price per gigabyte would have to be
comparable to fixed pricing, and usage
allowances would likewise need to be
somewhat comparable.
Whether telcos will continue to in-
vest aggressively in their fixed networks
is a real issue, if financial returns are bet-
ter in mobile and international arenas.
Verizon already has become a mo-
bile company with fixed assets. And
Verizon earns very little from its fixed asset portfolio.
At some point, opportunity costs will push many firms to
look elsewhere for higher returns. That will have important
ramifications for all other participants in the ecosystem.
Implications
For the immediate future, participants must contend with
business markets that are smaller – in some cases much small-
er – than they once were. Competition also is more intense.
Cable TV and other new providers are assuming larger
roles in the business, obviously representing some new po-
tential opportunities and threats for channel partners. While
much of the broader market opportunity has shifted to mo-
bile, a future issue is the shift to cloud-based applications and
online provisioning.
The issue is that “sales and distribution” of cloud-based
products are highly amenable to online purchases and sup-
port, directly by buyers, without reliance on retail, channel
partner or direct sales channels.
The bottom line is that the business customer segment
has changed quite a lot since 1996, both qualitatively and
quantitatively. It is a smaller, lower margin, more complicated
business with a greater number of suppliers and products, with
Internet channels and retail having grown in importance.
At the same time, more products and networks are “vir-
tual” and more amenable to self-provisioning. The impor-
tance of Wi-Fi hotspot access for mobile users provides one
example. Cloud computing facilities and app stores provide
other examples.
Among the mo
re shockingchanges, for those who have
been in the business for some decades, is the shrinking of
fixed network revenues overall, to half of 2002 levels. Busi-
ness customers are buying different products. But they are
spending half as much, as well.
That explains much about how sellers and buyers now behave.
st year (2015)
1%
1%
1%
1%
0%
0%
0%
1%
1%
Source: Deloitte University Press; company repo ts
$39
$6
$3
$9
$3
$43
$17
$28
1999 2013
Revenues
1999 2013
EBITDA
1999 2013
EBITDA-CAPEX
50
25
0
$79
$39
$33
$34
$14
$25
Source: Trading Economics
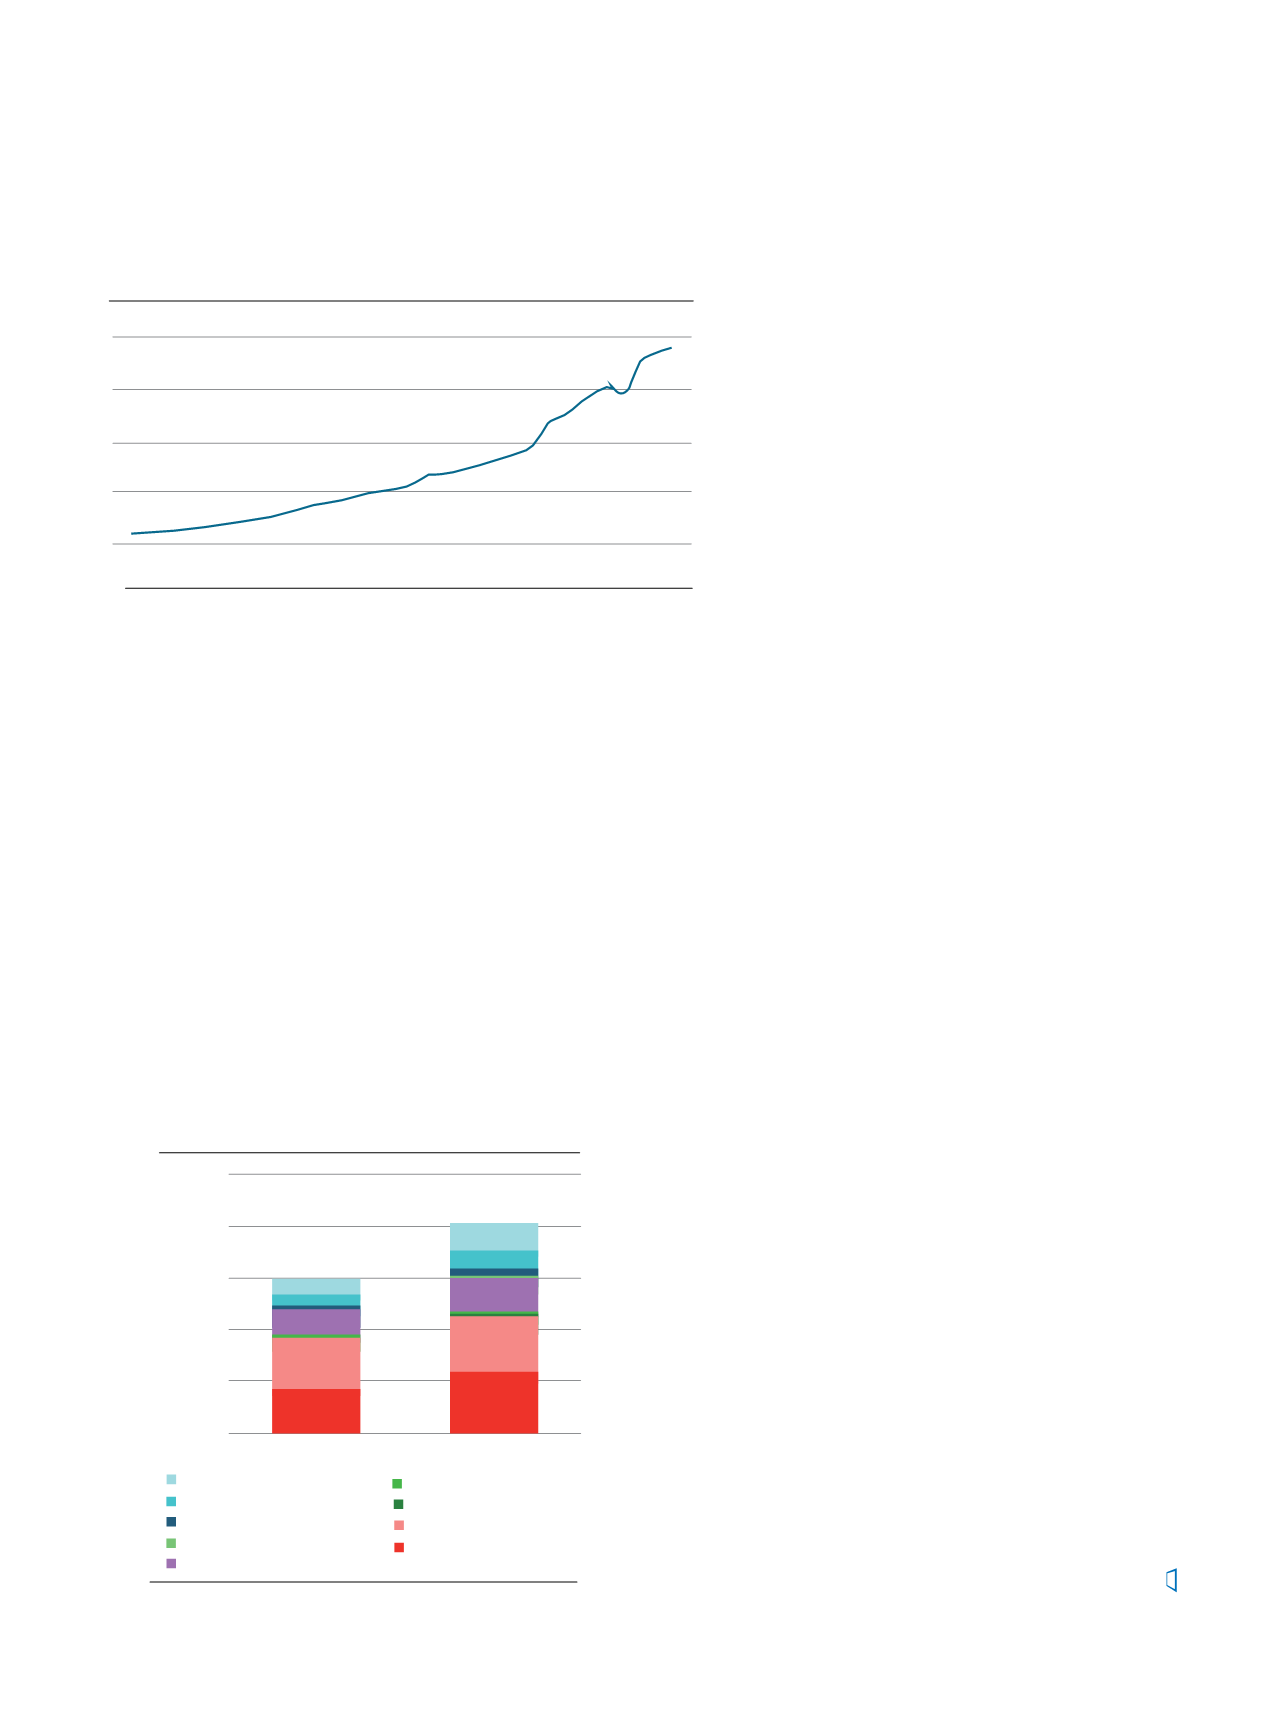
U.S. Telecommunications Revenue
1974
1981
1988
1955
2002
400000000000
300000000000
200000000000
100000000000
0
Source:
Telco2research.comCable Busine s Servic s and Select d
Competitors’ Revenues
Comcast Business
TWC Business
Charter Business
Mediacom Business
L(3) Enterprise proforma
Cablevision Lighpath
WOW Commercial
VZ SBS
AT&T SBS
$10,000
$8,000
$6,000
$4,000
$2,000
$-
Q1 2012
Q4 2014
Millions
-
Primary Catalysts for Channel Business Transformation
Cloud pushing in new directions
Demand for new services and IT delivery
Desire for recurring revenue model
New financial models are more lucrative
Vendors pushing for change
Margins on product sales declining
Defensive more against obsolescence
41%
36%
35%
32%
27%
23%
23%
Source: AT&T
G
Jag
.6
.4
.2
0
Q3
2014 2015
Q4 Q1 Q2 Q3
Source: HIS
Spending is up for unified commu
pure and hybrid PBXs, down for T
VoIP gateways in 3Q15
6%
4%
2%
0%
-2%
-4%
-6%
-8%
-10%
-12%
Global Revenew Growth
Percentage, 2Q15 to 3Q15
VoIP
Gateways TDM PBXs
Hybrid IP
PBXs
Pure
PBX
Percent Saying “Likely to Respon
Source:
InsideSales.com87% 87%
78% 78%
61%
100%
90%
80%
70%
60%
50%
40%
30%
20%
10%
0%
Tex
Message
M bile
Phone
Office
Phone
Voicemail
Source: The SIP School
If you could ask one question of your SIP
Comparing R
BRFSS, by a
When will you
support HD Audio?
What are you doing to
support FAX over IP?
Can you provide TLS/SRTP for
ecure signaling and media?
When will you support SIP
‘profiles’ to match each PBX/SBC
manufactures’s configuration?
Other
7.3
0 20 4
Source: Deloitte University Press; company reports
Verizon Performanc , 1999-2013, $ Bill on
$96
$120
$39
$6
$3
$9
$3
$43
$17
$28
1999 20 3
Revenues
1999 20 3
EBITDA
99 2013
EBITDA-CAPEX
150
125
100
75
50
25
0
Wireless
Wireline
$79
$17
$81
$39
$33
$34
$14
$25
ding Economics
ommunications Revenue
74
1981
1988
1955
2002
400000000000
300000000000
200000000000
100000000000
0
Source:
Telco2research.comCable Business Services and Selected
Competitors’ Revenues
Comcast Business
TWC Business
Charter Business
Mediacom Business
L(3) Enterprise proforma
Cablevision Lighpath
WOW Commercial
VZ SBS
AT&T SBS
$10,000
$8,000
$6,000
$4,000
$2,000
$-
Q1 2012
Q4 2014
Millions
Source: AT&T
Big Driv r for AT&T?
1 million
CUSTOMERS
AT&T’s net adds in connected cars:
AT&T has deals with these
automakers
A i
BMW
Ford
General Motors
Jaguar Land Rover
Nissan
Subaru
Tesla
Volvo
PARTNERS
.8
.6
.4
.2
0
Q3
2014 2015
Q4 Q1 Q2 Q3
Source: HIS
Spending is up for unified communications and
pure and hybrid PBXs, down for TDM PBX and
VoIP gat ways in 3Q15
6%
4%
2%
0%
-2%
-4%
-6%
-8%
-10%
-12%
Global Revenew Growth
Percentage, 2Q15 to 3Q15
VoIP
Gateways TDM PBXs
Hybrid IP
PBXs
Pure IP
PBXs
UC
Percent Saying “Likely to Respond” to Sales Call
Source:
InsideSales.com87% 87%
78% 78%
61%
43% 39% 35%
100%
90%
80%
70%
60%
50%
40%
30%
20%
10%
0%
Text
Message
Mobile
Phone
Office
Phone
Voicemail Linkedin Instant
Messaging
Facebook T
If you could ask one question of your SIP trunk provider what wo
When will you
support HD Audio?
What are you doing to
support FAX over IP?
Can you provide TLS/SRTP for
11.55%
23.1
48
Channel
Vision
|
January - February 2016