


 40 / 76

CMR estimates the business voice market at $31
billion annually and business data at $86 billion a year.
Mobility services purchased by businesses represent $21
billion a year, but cable companies have not yet entered
that segment.
A TNR study of 6,500 businesses in 2015 found cable
TV small business market share as high as 17 percent.
Also, fixed network voice and data product spending at-
tributable to cable providers rose more than 38 percent,
climbing from 12.2 percent to 16.9 percent during a
two-year period. TNS attributed the gains to a heavier
small business reliance on Internet access and the need
for greater bandwidth; two areas where larger cable pro-
viders excel, TNS said.
If one assumes the U.S. small office and
home office segment represents $200 mil-
lion in addressable revenue, while the SMB
segment represents $1.9 trillion in annual
addressable revenue, while the enterprise seg-
ment is a $3 billion opportunity, it is clear why
cable operators always have expected to move
up the value chain from the consumer and
SMB segments to the enterprise segment.
Up to this point, cable-provided backhaul
for mobile operator tower sites has been a
prime example of successful pursuit of enter-
prise opportunities. But we can expect more-
extensive federation deals between cable TV
operators that will allow a better pursuit of
enterprise multi-location data services op-
portunities, in particular. Comcast’s ability, in
2016, to supply a symmetric 2-Gbps service
to about 85 percent of its total U.S. locations will underpin
part of the effort. Wholesale agreements with other out-of-
region cable operators will provide the other element.
U.S. cable operators now are readying a bigger as-
sault in the enterprise services segment, something many
skeptics believed would be difficult. But cable operators
likely are going to begin taking more market share in the
enterprise segment.
Mobility is Next
It also is virtually certain that cable operators are going
to enter the mobility business. It is the last remaining big
telco revenue driver where cable has no presence. And cable
executives clearly believe mobile will allow them to build
successful quadruple-play offers.
Broadly speaking, cable TV operators believe in the value
of the “quadruple play,” where fixed network voice, video
entertainment and Internet access are bundled with mobility
services. Just as broadly speaking, telcos are more skeptical
about the value of the quad play. Liberty Global, for example,
is absolutely convinced the quad play is a winner. Verizon says
its has not seen evidence of the demand in its U.S. markets.
Source: Excelacom
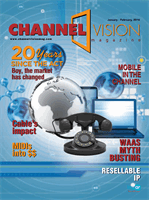
Source: Insight Research
Global Wireline and Wireless Revenues,
2014-2019 ($Billions)
$3,000
$2,500
$2,000
$1,500
$1,000
$500
$0
2014 2015 2016 2017 2018 2019
Wireline
Wireless
$Billions
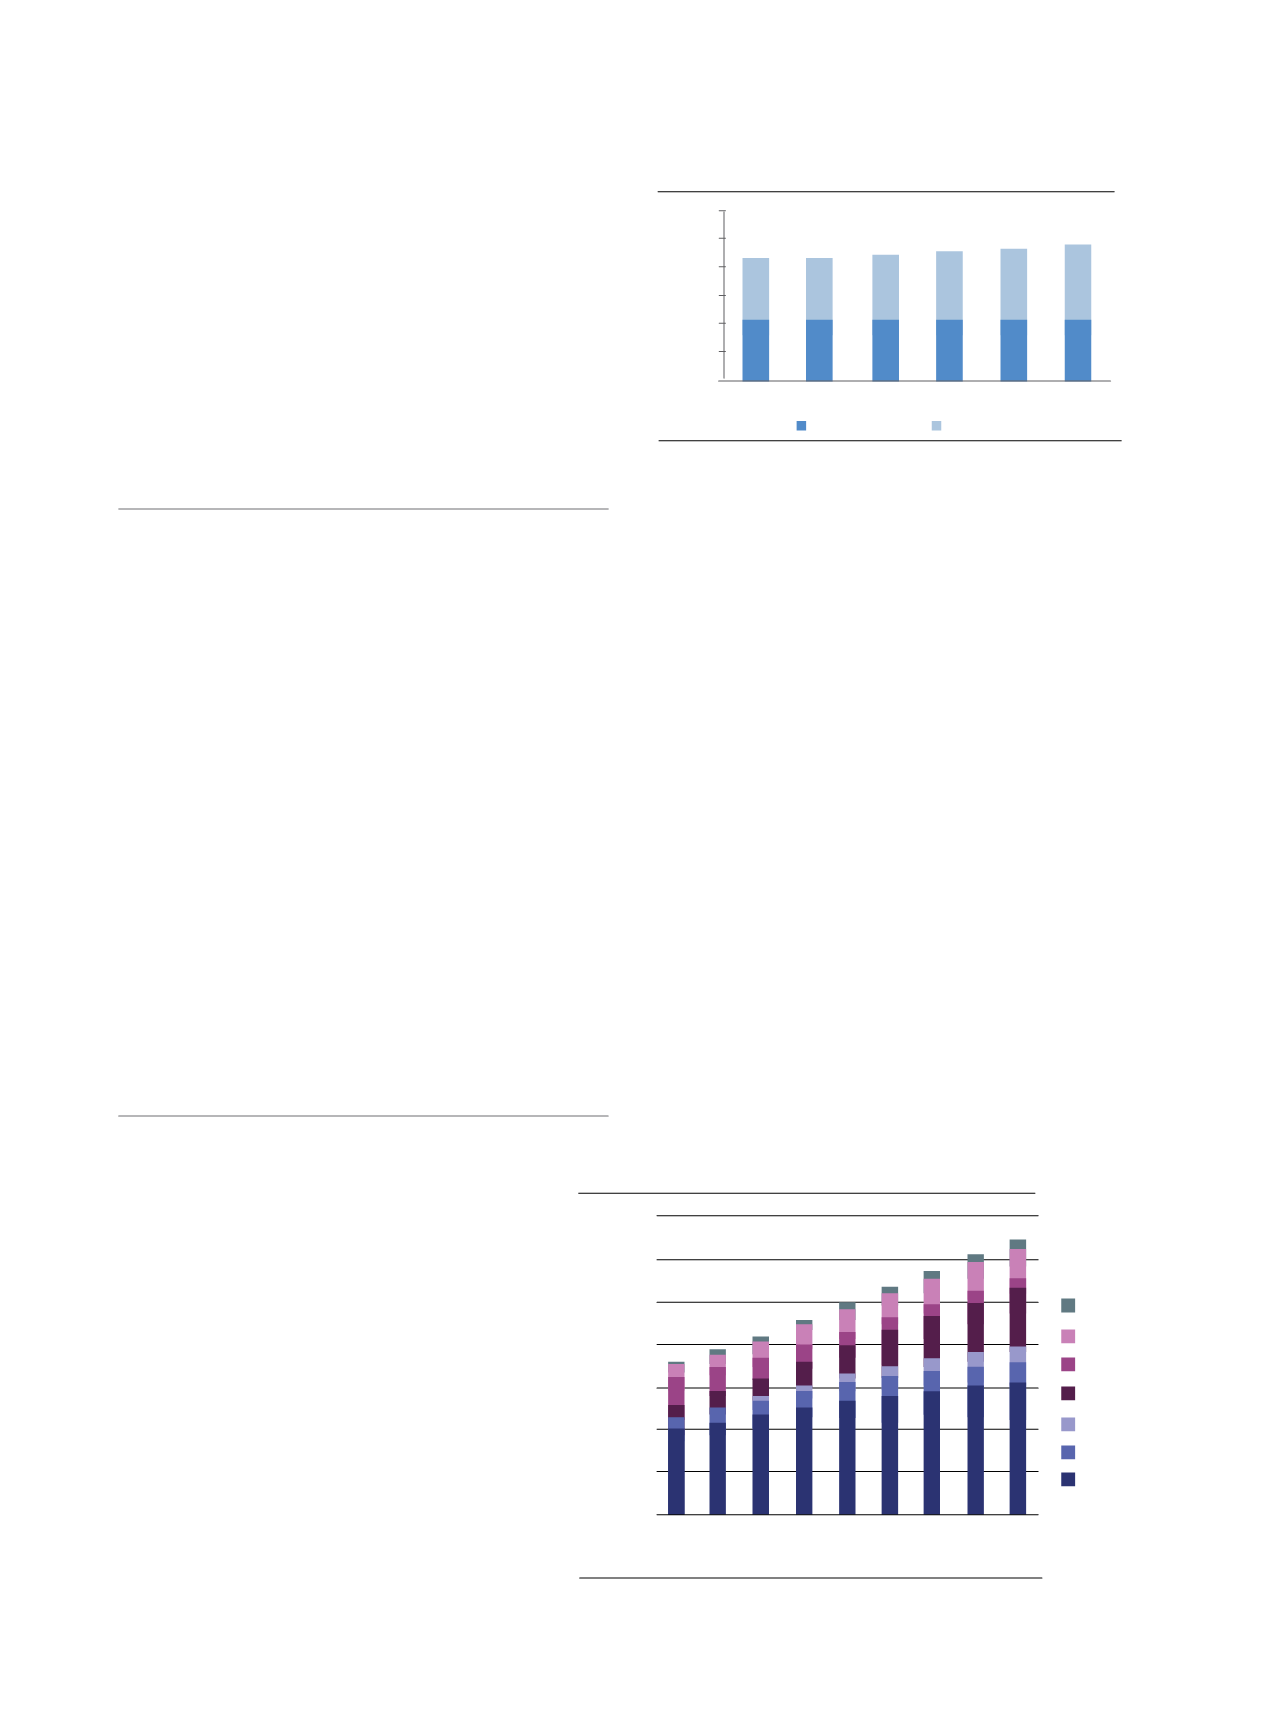
Source: Analysys Mason
Emerging Asia Fixed and Mobile Revenue
350
300
250
200
150
100
2008
2009
2010
2011
2012
2013
2014
2015
2016
50
0
Retail revenue (USD billion)
Business network s
Fixed braodband
Fixed voice
Handset data
Mobile broadband
Mobile messaging
Mobile voice
Source: Deloitte University Press; company reports
2002 and 2013 U.S. Telecommunications and Content Distribution
Revenues, $ Billions
2002 2013
Consumer
2002 2013
Consumer net
2002 2013
Business
2002 2013
Business net
350
300
250
200
150
100
50
0
Cable and other
DBS
Wireless
Wireless
222
316
185
226
163
139 130
107
Source: Center for Disease Control; U.S. Census; Market Realists
30%
20%
10%
0%
Fixed broadband
Residential fixed voice
37%
Source: Excelacom
SoHo
(micro) Business
- Emplyed; $0.
Trillion in Revenue
SMB Business
5-499 Employed;
$1.9 Trillion in Revenue
Large Enterp i es
2,500+ Employed;
Over $3 Trillion in Revenue
Source: Insight Research
Global Wireline and Wireless Revenues,
2014-2019 ($Billions)
$3,000
$2,500
$2,000
$1,500
$1,000
$500
$0
2014 2015 2016 2017 2018 2019
Wireline
Wireless
$Billions
Source: Analysys Mason
Emerging Asia Fixed and Mobile Revenue
350
300
250
200
150
100
2008
2009
2010
2011
2012
2013
2014
2015
2016
50
0
Retail revenue (USD billion)
Business network services
Fixed braodband
Fixed voice
Handset data
Mobile broadband
Mobile messaging
Mobile voice
2002 and 2013 U.S. Telecommunications and Content Distribution
-
The point is that cable TV
operators have become
the primary market
share beneficiaries of
the deregulation of local
telephone services in the
U.S. market, and likely
will develop in that same
way in European and other
fixed network markets
they might enter.
40
Channel
Vision
|
January - February 2016